
What is Kenpom's Algorithm?
Get down with the 4 Factors

Sometimes it’s simple. What determines if I use an umbrella? If it’s raining outside. The presence of rain is highly correlated with the use of umbrellas. That’s because the dependent variable, use of umbrellas, is impacted by just a single independent variable, rain.
But basketball isn’t that simple. We don’t have a single variable to determine winning, because a winning team has to do several things well. But what are those specific things? It’s intuitive that shooting is the most important, but how much more important is it than anything else, like turnovers or rebounding?
To understand that we need to run a regression model. Find all the data that you can about basketball performance, throw it into the statistical martini shaker, and pour it out. The regression will tell you which variables matter (shooting and rebounding), which don’t (length of tenure of head coach, pace of play, if the mascot is an animal), and by how much.

The 4 Factors
This brings us to the 4 Factors (actually 8 because it’s both offense and defense), the crux of Kenpom’s algorithm. The factors, with roughly these weightings, predict more than 95% of what constitutes winning a basketball game:
Shooting 40% | Turnovers 25% | Rebound your misses 20% | Get to the line 15%
These are the original percentages, or coefficients, that basketball analytics progenitor Dean Oliver published 25 years ago, albeit for the NBA.
Adapting to College Basketball
CBB Analytics is a fantastic website that actually publishes regression models specific to college basketball. Kenpom doesn’t publish his regressions, for understandable reasons; although he does explain enough that it’s understandable what he’s doing.
Below is CBB’s model, estimating a team’s offensive and defensive efficiency, of which the D1 average is 105 points per 100 possessions. This how we apply the 4 Factors into real life, on-court performance.
Predicted Offensive/Defensive efficiency = 32.333 + 1.55*eFG% + 0.47*ORB% - 1.55*TOV% + 0.19*FTA Rate
32.3: The constant term. This means if a team made no shots, got no rebounds and had no turnovers, they would have an offensive efficiency rating of 32. It’s the foundation to which we will add other stats.
+ 1.55*eFG% Multiply a team’s effective field goal percentage by 1.55 and add that to the constant of 32. This means that each percentage point increase in eFG% will result in a 1.55 point increase in a team’s offensive rating.
+ 0.47*ORB% Same as above, though instead of multiplying by 1.55, for offensive rebounds it's .47. Makes sense, since scoring is a lot more important that just getting an offensive rebound.
- 1.55*TOV% The coefficient on turnovers is negative, meaning each percentage point increase in turnover rate results in a subtraction of 1.55 from a team’s offensive rating.
+ 0.19*FTA Multiply a team’s free throw rate by .19 (attempts, not makes) and add it in.
Now let’s apply this formula to Providence’s performance this season, using their actual 4 Factors:
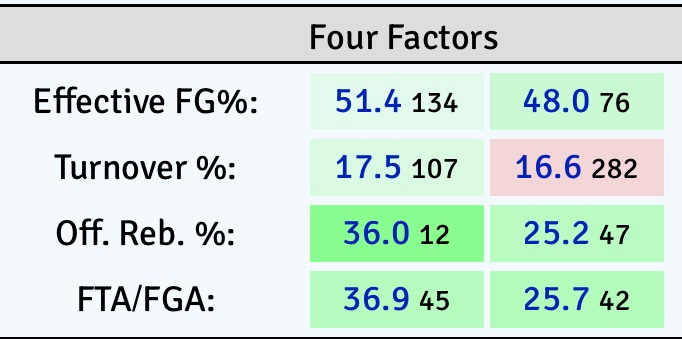
Offensive rating = 32.33 + 1.55(.514) + .47(.360) - 1.55(.175) + .19(.369) = 108.8
We get 1.088 points per possession, a little lower than Providence’s actual unadjusted offensive efficiency of 1.11. The difference in between the predicted and the actual is called the residual, and an analyst will run the regression in many ways using different techniques in order to get the closest estimated to actual as possible.
Defensive rating = 32.33 - 1.55(.480) + 1.55(.166) - .47(.252) - .19(.257) = 97.7
Defense, much closer! The estimated result of 97.7 is within one percentage point of the actual unadjusted defensive efficiency of 98.5.

For Friartown by Friartown
Let’s now run our own model, using the 4 Factors data for all of D1 for the current season. But instead of offensive and deficiency efficiency like CBB, I’m going to use team wins as the dependent variable.
We can then compare Providence’s estimated wins to actual wins. If it’s accurate, then we can re-adjust the 4 Factor weightings specifically to Providence.
Here is the statistical output…

…in a more readable format:

A deeper dive on the coefficients for offense:
eFG%: each percentage point increase in eFG% is associated with an additional .7 wins.
For example, if a team with an eFG% of 50% has 10 wins, and they improve that to 52%, then they would improve to an estimated 11.4 wins.
In Big East terms, if the team with the lowest eFG% in the conference, Butler, improved to the level of the best team, Marquette; then Butler would win an estimated 14 league games instead of their current 7.
TO%: Both CBB, Dean Oliver and the Friartown model estimate that turnovers are critically important. Each one percentage point increase in turnover rate is associated with .54 less wins.
For example, if a team’s TO rate deteriorates from 15% (which is good) to 20% (which is bad), then they would expect to lose 2.5 additional games over the course of the season (I’m talking about you, Seton Hall).
ORB%: The Friartown model estimates a slightly greater influence of rebounding over CBB, although not as much as Oliver’s NBA-oriented model.
FTR: Both CBB, Dean Oliver, and the Friartown model predict that getting to the line is the least significant of the 4 Factors.
Again, Providence’s 4 Factors from Kenpom. Let’s plug them in the regression and see how many wins it estimates, and then we can compare it to the actual.
Estimated number of Providence wins =
Offensive performance:
2 (the constant term) + 51.4(.7) - 17.5(.54) + .23(36) + .12(36.9) = 41.3
and
Defensive performance:
- 48(.53) + 16.6(.52) - 25.2(.2) - 25.7(.04) = -22.8
What does that equal? 41.3 - 22.8 = 18.5
Almost identical to Providence’s actual win total of 19.

Since our regression is predictive of actual performance, we can now apply these weightings to the 4 Factors; we now have our algorithm.
Let’s revisit the original Dean Oliver weightings…
Shooting 40% | Turnovers 25% | Rebound your misses 20% | Get to the line 15%
…and apply the new weightings, specifically for Providence:
Shooting 43% | Turnovers 37% | Rebound your misses 15% | Get to the line 5%
And that’s (roughly) how Kenpom does it. He runs a regression to isolate the specific predictors of success (the 4 Factors), and then builds an algorithm with weightings as determined by the regression. That weighted algorithm is then applied to a team’s actual performance, and it predicts how that team may perform in the future.
How does that segue with the adjusted points per possession and Pythagorean win percentage that I explained in a previous post? I don’t know, as much of his work is proprietary. But this the basic outline.
What does this mean for Providence?
It means that shooting and turnovers matter more to Providence than rebounding and free throw rate. That’s true of everyone, but even more so for Providence.
But looking at Providence’s performance more closely, it would seem that one area of improvement is forcing more turnovers on defense.
Up until two weeks ago, offensive turnovers were also an issue. But since Jared Bynum returned to the lineup against Butler on January 25th, Providence has committed a turnover on just 12.5% of its offensive possessions, good for 14th in the country. An area of weakness is now an area of strength. And according to Providence’s performance in the 4 Factors, it’s time for a similar improvement on the defensive side of the ball.