Part 1: What is Kenpom's Luck Factor?
Kenpom's Luck? More like Kenpom's F&!K! No but seriously, was Providence lucky?
I’ll give away the conclusion upfront - I don’t think it’s fair to call it “luck.” What the measure is - most explicitly - is unexplained performance, based on a team’s points per possession.
But like most Providence fans, I’ve heard enough about luck, and I feel the need to address it. So I’m going to explain what it is and how it’s calculated, with some interesting background along the way.
But before we address the luck metric specifically, we must begin with the more basic and ubiquitous formula used in basketball analytics; the one Kenpom uses to estimate individual game probabilities.
The Pythagorean Win Theorem
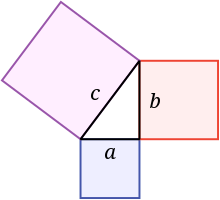
And for that, we start our journey in ancient Greece. Ok, I’m not actually going to go through the whole story, but it is pretty cool. The short version - a nighttime security guard with idle time on his hands dusted off an ancient geometric formula and applied it to sports.
Bill James’ application of the Pythagorean Theorem was brilliant. Typically used to determine the space between lines of a triangle, James used it to measure space in a different way - the metaphorical space between a team’s wins and losses. This allowed James to determine a team’s projected record based on how they score and defend at the individual play level, and how that may deviate from their actual wins and losses.
If the estimated value is higher, then the team is underperforming. If it’s lower, they are overperforming. In other words, they may be “lucky.”
I’ll present the actual formula below so you can see how the sausage is made, and maybe even try calculating yourself. You can tweak the offensive and defensive efficiencies of a team to see how win probability changes. Bill James, as you probably recall, applied the formula to baseball, so the exponent he used (as represented by the 13.91 below) was a 2. Former Houston Rockets and current 76ers Executive Daryl Morey is credited with adapting the formula to basketball, using the exponent 13.91 in his version. John Hollinger, another usual suspect basketball statistician, uses 16.5. Ken Pomeroy used to use 11.5, but now uses 10.25.
It’s not terribly important what the exponent is, a statistician will often tweak it as they back-test data to see which delivers an estimation closest to the actual results.
So here is the Pythagorean Win Percentage applied to Providence’s next game, at home against Georgetown:
The “points for” will be Providence’s unadjusted points per possession multiplied by the league average efficiency.
Providence’s unadjusted PPP this season: 1.123
Division 1 average: 1.05
1.12 x 1.05 = 1.18
And since they are facing Georgetown’s defense, we will multiply that total by Georgetown’s adjusted defensive efficiency.
Georgetown’s adjusted defensive PPP: 1.08
1.18 x 1.08 = 1.27
Because Georgetown’s defense is worse than the average of 1.05, Providence’s expected points on offense goes up.
We then include a 1.4% bonus for home court for Providence.
1.27 + 1.4% = 1.3
We do the same calculation for Georgetown, only they get a 1.4% subtraction for playing on the road. And because Providence’s defense is better than league average, allowing just .98 versus 1.05, when we adjust Georgetown’s expected points scored for Providence’s defense, it decreases.
Here is Georgetown’s calculation: 1.015*1.05*.989-1.4% = 1.039
There you have it. 1.3 is “points for” and 1.039 is “points against” if we want to determine Providence’s estimated win percentage at home against Georgetown.
Plug those into the formula above, using Kenpom’s college basketball exponent of 10.25.
Estimated winning percentage = 1.3^10.25 + 1.039^10.25/ 1.3^10.25
…and we get Providence as a heavy favorite at 91%.
Kenpom adds a couple tweaks to his formula, including weighting more recent performances. This helps explain why his estimation is 94%, 3 percentage points higher than my calculation (and in favor of Providence for once!) Regardless, Pythagorean Win Percentage is the baseline formula, one that has given birth to an entire cottage industry of basketball analytics.
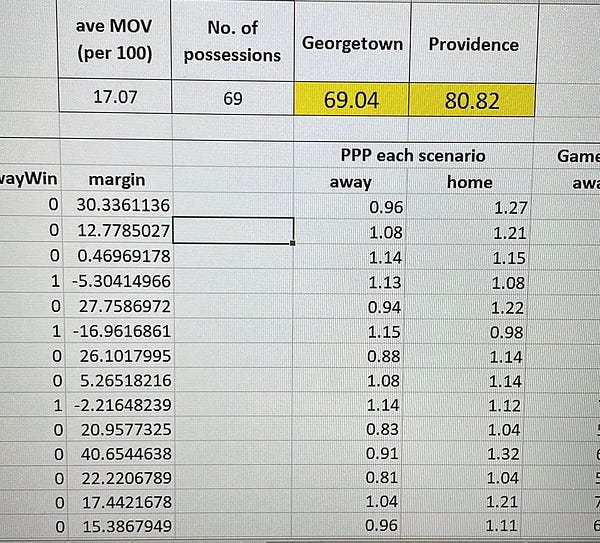
There isn’t necessarily one right way to calculate “points for” or “points against” when we are dealing with adjusted efficiencies. Typically you choose whatever is closest to the actual game results as possible. For example, I run a 10,000 game simulator before each Providence game and I use a slightly different method; the basis is a simple multiplication of opposing teams’ offensive and defensive efficiencies.


This concludes Part 1. It was necessary in order to build on Part 2, the actual Kenpom “Luck” metric. Tomorrow, in Part 2, we’ll directly address the luck calculation, which is another standard formula called the Correlated Gaussian Method, otherwise known as “The Basketball Bell Curve.”


I would not call it luck. It's the predictor not knowing all the factors influencing the outcome. Calling it luck allows us to take sides, i.e. hate the other team because they were lucky or feel better about our team because they were unlucky. Put another way, it relieves our team of responsibility.
Winning more than 50% of one possession games is said to be lucky. Well, do you also believe that all people perform the same under that pressure?