


Part 2: What is Kenpom's Luck Factor?
Kenpom's Luck? More like Kenpom's F&!K! No but seriously, was Providence lucky?

In Part 1, we addressed the Pythagorean win percentage and how to predict individual game results based on per possession data. In Part 2, we unpack the correlated gaussian method, otherwise known as Kenpom’s luck factor.
------
Why would someone run a statistical model? It’s because they have an idea, a theory about how the world works and they want to test it. You’re familiar with the term, testing the hypothesis.
For the correlated gaussian method in basketball, the theory is that a team’s true winning percentage, based on scoring margin and consistency of play, might deviate from their actual number of wins and losses. This might be due to randomness, a certain “bounce of the ball”, or for other reasons.
Let’s begin with a graphic representation of Providence’s gaussian distribution, points scored and allowed from the 2021-22 season. The grey curve represents points scored, 2,360. The blue curve is the points allowed, 2,180.

You’ll see that the bell curve for Providence’s “points scored” (the grey) is shifted to the right of their “points allowed” curve. This means Providence has a net positive scoring margin.
The red line is the median points scored. The top of Providence’s “points scored” bell curve is to the right of the median, it’s higher. The top of the “points allowed” is to the left of the median, it’s lower. The overall difference in value between these two curves will result in an estimated win percentage.
If a team’s actual record irl is lower, then they are underperforming, or “unlucky”. If the actual record is higher, then they are overperforming, or “lucky.”
That was graphically. Now let’s reveal the actual formula, the same representation but mathematically. Upfront, we know that Providence had a 5.3 net point differential over 33 games, which, intuitively, doesn't suggest an 82% win percentage, especially with the 53rd best strength of schedule. But let’s see what the data says.

This is a more rigorous calculation than the Pythagorean win percentage formula, but thankfully there’s no need to calculate it by hand. The excel formula NORM will calculate it with just 4 inputs from the data set, which is simply the scores of all of Providence’s games from last season.
But I will break down each component anyway, and how it’s calculated, so the secret sauce won’t be such a secret.
Before we do, a side note on Consistency. Consistency (as measured through variance and standard deviation of game outcomes) is studied by basketball analysts. This is because theoretically, a more consistent team can achieve the same number of wins with a lower net margin of victory than a less consistent team. That’s because the volatile team must score more, or allow less, to “make up” for their more erratic performances.
-----
NORM means the pattern of the data, in this case a normal standard distribution, as represented by a bell curve.
Rtg is Providence’s adjusted efficiency. Last season that was +15.89 (+11.5 on offense + 4.4 on defense).
OppRtg is the collective rating of all of Providence’s opponents, also their adjusted Strength of Schedule, which was +7.74
SD is the standard deviation, or a measure of how many data points fall close to the mean, and how many are further away. A normal standard distribution is defined by having ⅔ of its data points within one standard deviation of the mean.
The standard deviation of Providence’s margin of victory last season was 12.8.
That means ⅔ of Providence’s games last season finished within a spread of 12.8 points.
The Variance and Covariance won’t have any real world meaning, they represent the relationship and movement between variables. For this example, I get a variance of 131.6 and a covariance of 53.74.
You plug those into the formula (or just use the NORM function on excel) and you get an expected win percentage of .684
In 33 games, that .684 winning percentage equals 22.57 wins, or 4.4 wins less than the actual total of 27. Those 4.4 wins also represent 16.4% of the total of 27 (4.4/27).
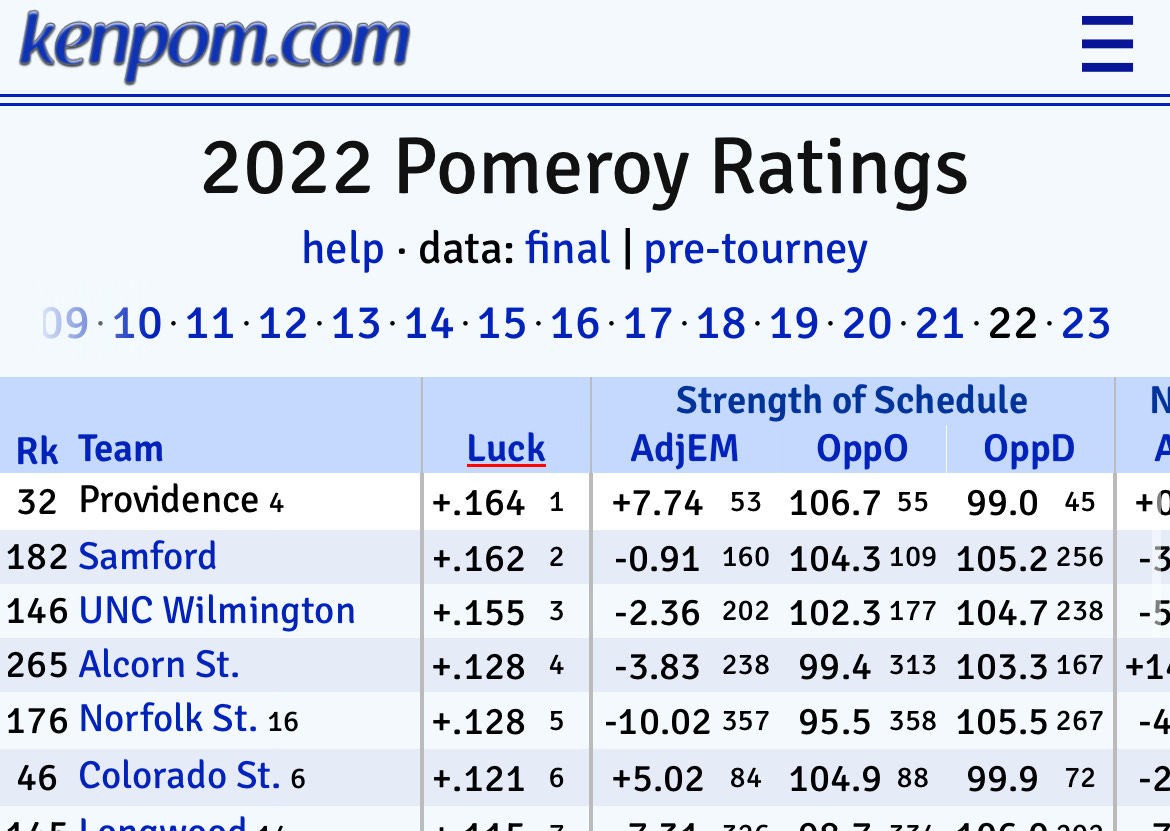
Therefore, the gaussian method predicts that Providence outperformed the estimated winning percentage by .164.
…and there it is, on Kenpom, staring back at us. Easily picked up by critics to unduly shape the narrative surrounding the 2021 Providence Friars.
Now that the math is done, let’s take a step back. I just filled an excel sheet with formulas, but for what? This is in the weeds for sure, but if anyone is still reading, what in the good name of Dave Gavitt does this actually have to do with the basketball games we witnessed, played in real life, on a real court?
There is a point where the analytics make sense, are helpful, explanatory. And there is a threshold where they are not. This threshold is particularly difficult to understand in college basketball, which struggles to categorize itself due to the broad diversity in quality among the 358 participants.

But I do owe the luck enthusiasts an explanation. And so I will offer one - why did Providence lead the country in positive deviation between their actual record and their expected record using the correlated gaussian method?
There were a couple reasons. One, fully half of Providence’s losses were blowouts, that’s unusual for an elite team. I have heard various explanations as to why that happened, somehow it always involves the flu. And as I addressed in Part 1 of this post, not blowing out your buy-game opponents has the effect of lowering your adjusted efficiency margins, which lowers your expected performance, leading to an analytical surprise if you actually go 27-6.
One narrative that was particularly irritating, and not based on any advanced data, was that Providence played teams with a lot of missing players, which was lucky.
On one hand, that’s true. Providence fans should be willing to admit that it was fortunate to play Wisconsin without Johnny Davis, Connecticut without Adama Sanogo, and Seton Hall without two of their rotational bigs. However, if you’re going to lead with that, then you need to complete the story. And the full story is this:
Providence was fortunate to play three good teams without some key players. But Providence also beat the best defensive team in the country, Texas Tech, without their primary point guard in Jared Bynum. And more than a dozen games into their season (and after Providence had already built a top-15 resume), the Friars still had missed more rotation minutes to injury than their opponents, with Bynum, AJ and Minaya all missing time.

It’s not statistically defensible to call it luck
From a statistical perspective I can’t claim that a positive deviation from the gaussian method is luck. I’m limited to presenting the data for what it is - unexplained performance. We don’t know the actual factors, they could be as benign as random variability with no explanation…
…or maybe Al Durham really did crack the code on how to manufacture points at the line late in games. Or that Ed Cooley really does know something about late-game execution that others don’t.
The reason why we shouldn’t call it luck is because luck implies something that was undue, unearned; through no effort of your own. But the extra 4.4 wins didn’t fall out of a tree, or appear in a puddle on the floor of Amica Mutual Pavilion. The 4.4 wins is something that Providence earned in 2021, they did it.
What is statistically defensible is the claim that, at the time they were “ranked” 50th in Kenpom, that their projected future performance should be lower. There is strong statistical evidence that Adjusted Efficiency margins are indeed predictive of future performance.
A justifiable claim, that is until Providence posted a +16.1 AdjEM in three games in the NCAA tournament, which was the 7th best among the 68 teams, an elite 8 level performance. But the ball didn’t bounce that way, they must have been unlucky.
So for the podcasters, beat writers and home couch warriors like myself that venture into claims of “luck” or “it says x on Kenpom”, I ask that you try…just try to understand what you’re claiming. And if not? Please read my substack.
Thanks to everyone for reading. Next week we’ll take a look at the 4 Factors along with the underlying regression model that explains why effective field goal percentage, offensive rebounding, turnover percentage and free throw attempts (in that order) really are the key to winning in college basketball.