


Predicting the 2023-24 Friars Offense
Kim English and his NBA style in Friartown

Even though it morphed over time from its flex-based roots, I believe Ed Cooley ran the system he did out of necessity. For the past 11 seasons, success was the NCAA Tournament. And that meant, at times, Providence had to win games as the less talented team.
It’s not that Cooley’s teams were bereft of talent. But Providence is the 3rd winningest Big East program over the past decade, with a talent level probably closer to middle of the pack.
Consequently, at times it felt like Providence was manufacturing wins the way a baseball team manufactures a run. But that’s how you reach 10 conference wins when your best player is Rodney Bullock.
The approach was structured and intentional. 65 possessions or less. ⅓ or more of your possessions go through the post, your most consistent matchup advantage. Squeeze 1 point per possession out of the rest of the roster. If your defensive-oriented team holds up on that end, you win the game.
But what are the drawbacks of that style? Bryce Hopkins (like Rodney and LaDontae before him) gets the ball at the elbow in front of a double team. There’s no one to guard Omari Spellman or Jack Nunge. Guys with ball skills can’t take advantage of the open floor on a rebound, they have to pull it back.
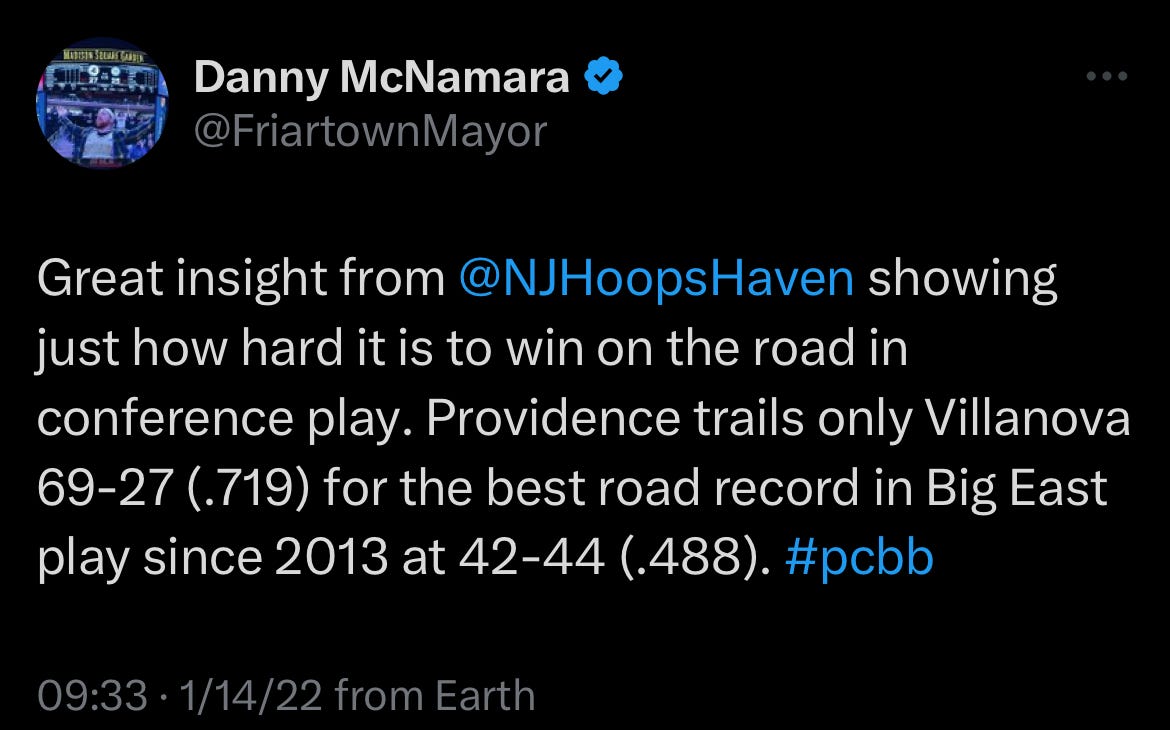
It just doesn’t, like Kim English said, flow.
Perhaps 2023-24 offers the roster that Cooley never had. Bryce Cotton was an all-time scoring great, but those teams were still more workmanlike than explosive. Bentil and Dunn were similarly fantastic, but that team couldn’t score from all 5 positions on the floor. The 2021 team was also great, but it didn’t include real NBA talent. Last season’s team offered a glimpse, but this roster is better.
Simulating the season
To predict Providence’s offense, I’ve simulated the season 10,000 times using parameters based on style of play and individual player performance. And while I’m not sure what the defense will look like, it seems almost certain that these Friars will score a ton of points.
First, let’s look at the parameters:
Pace of play
During the season, I simulate each game based on the number of game possessions.
There are teams that play to the extremes, but roughly 80% of teams in D1 play within 65 to 70 possessions a game. Providence has typically been on the lower end of that average range.
Teams can intentionally slow the game down (or speed it up) when they possess the ball, but only to a certain extent.
So I don’t expect a dramatic difference in pace. Based on the previous 2 seasons comparing English and Cooley’s teams, we can expect the average Providence possession to be about a second faster, from 18 to 17 seconds. This adds an additional 4 possessions per game, from 66 to 70, or 3 shots.
Three Point Attempts
In English’s first season, when his shooters were all healthy, 40% of Mason’s shot attempts were from Three, in the 96th percentile. Providence averaged 2 percentage points lower than the D1 average in 3-point attempts for most of Cooley’s tenure, although that changed over the past two seasons.
Per Synergy, here is the difference in shot distribution of English’s George Mason teams vs. Providence over the past 2 seasons:
At the rim -5.5%
Midrange -2.7%
From 3 +8.1%
The way the numbers shake out, 2-point attempts stay the same and 3-point attempts increase, from 20 to 24 per game.

Individual player performance
Bart Torvik’s fantastic website projects player performance for the coming season. While we don’t have full clarity on the model, we know it includes an improvement and increase in usage as a player gets older, with adjustments based on the composition of the roster (good players on bad teams get more shots, etc). Freshman are graded according to their recruiting ranking.
I used Torvik’s projections as a baseline, but also applied a standard deviation parameter that will control for game by game variability in player performance.
For example, last season Bryce Hopkins scored as few as 4 and as many as 29 points in a game, with everything in between. The standard deviation of his game by game performance was +-6.5 from an average of 15.8. This means that in ⅔ of games, he scored between 9 and 22 points. In other words, his scoring totals were all over the map.
Compare that with another high usage player, Devin Carter. Even though Carter had nearly as many FG attempts as Hopkins (450 vs 466), Carter’s standard deviation was just 4 points, meaning his output on a game by game basis was more consistent, almost always between 10 and 17 points.
In the scenario we’ll add each players’ deviation tendency along with their scoring and rebounding Torvik projections.
To summarize all the variables in the model:
Possessions per game/ pace of play
Composition of shots
Projected average points
Projected average rebounds
Estimated usage
Deviation of previous performance
I then ran the 10,000 game simulation, narrowed the parameters based on the results, and re-ran the scenario but forced all results to fit in one of 33 cohorts, the equivalent of a full 33 game season.
The Golden State Friars
…and oh boy, we got a juggernaut. Providence averages 80.3 points per game, which would have finished 10th in D1 last season. The unadjusted points per possession is 1.13, which would have finished 12th, just behind Baylor.
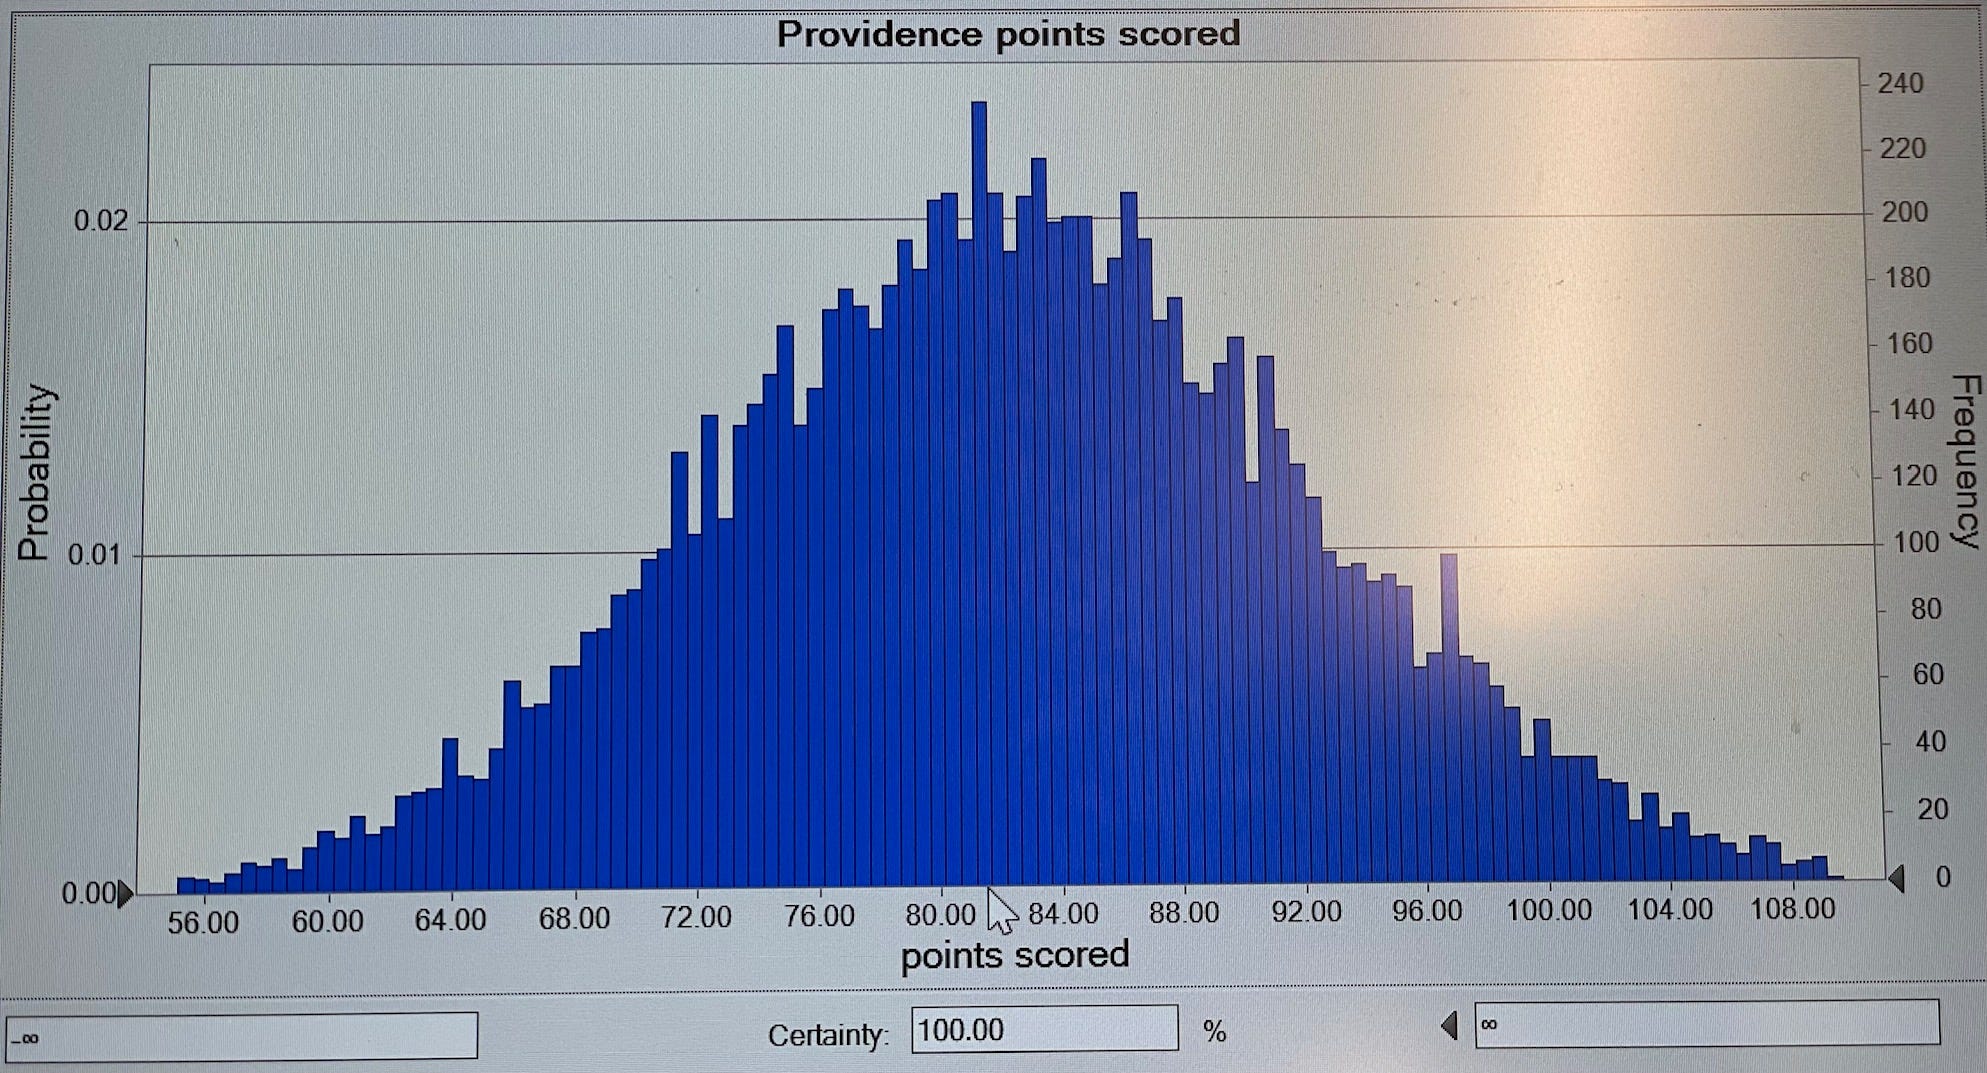
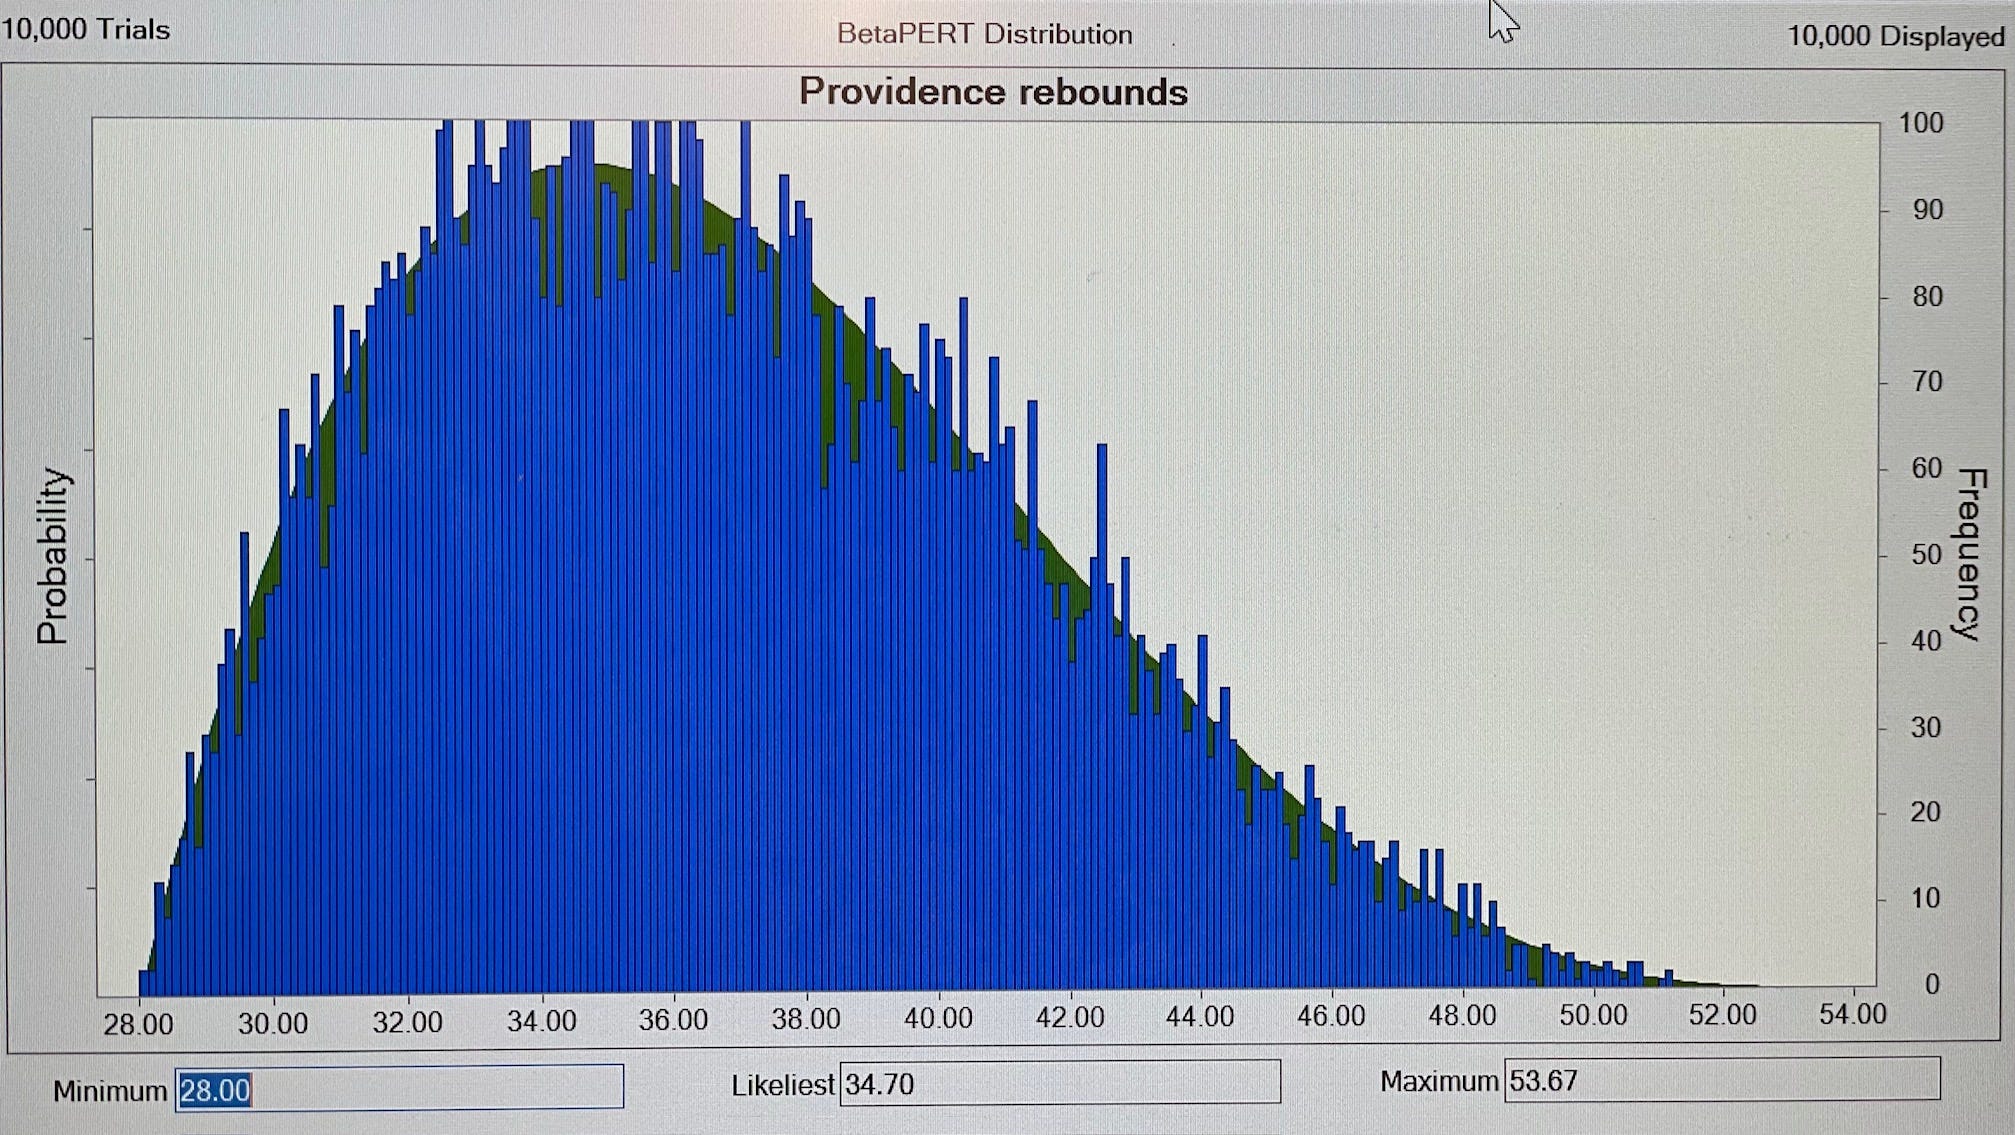
Rebounding totals weren't quite as exemplary. In the simulation, Providence averaged 34.7 rebounds per game, good for 158th in D1 last year. Last year, Providence had 14 games of 40 rebounds or more, including a high of 51 against Manhattan. In this simulation, there were just 7 games with 40 rebounds.
Let’s look at individual player results:
Bryce Hopkins
Bryce Hopkins goes off, averaging 21.3 points per game. The bell curve is shifted to the right, meaning the collection of estimated performances are tilted to the higher end of the distribution (better outcomes), unlike the team rebounds. In 80% of games, Hopkins scores more than 14 points.
Why does it predict such a monster season? Last season Hopkins shot 41.7% from Three, which was 3rd in the Big East. But he only had 79 attempts. The increased usage without a corresponding decrease in efficiency equals a jump in production.
Hopkins’ rebounding numbers decreased however, to just 6.5 per a game, down from 8.5.
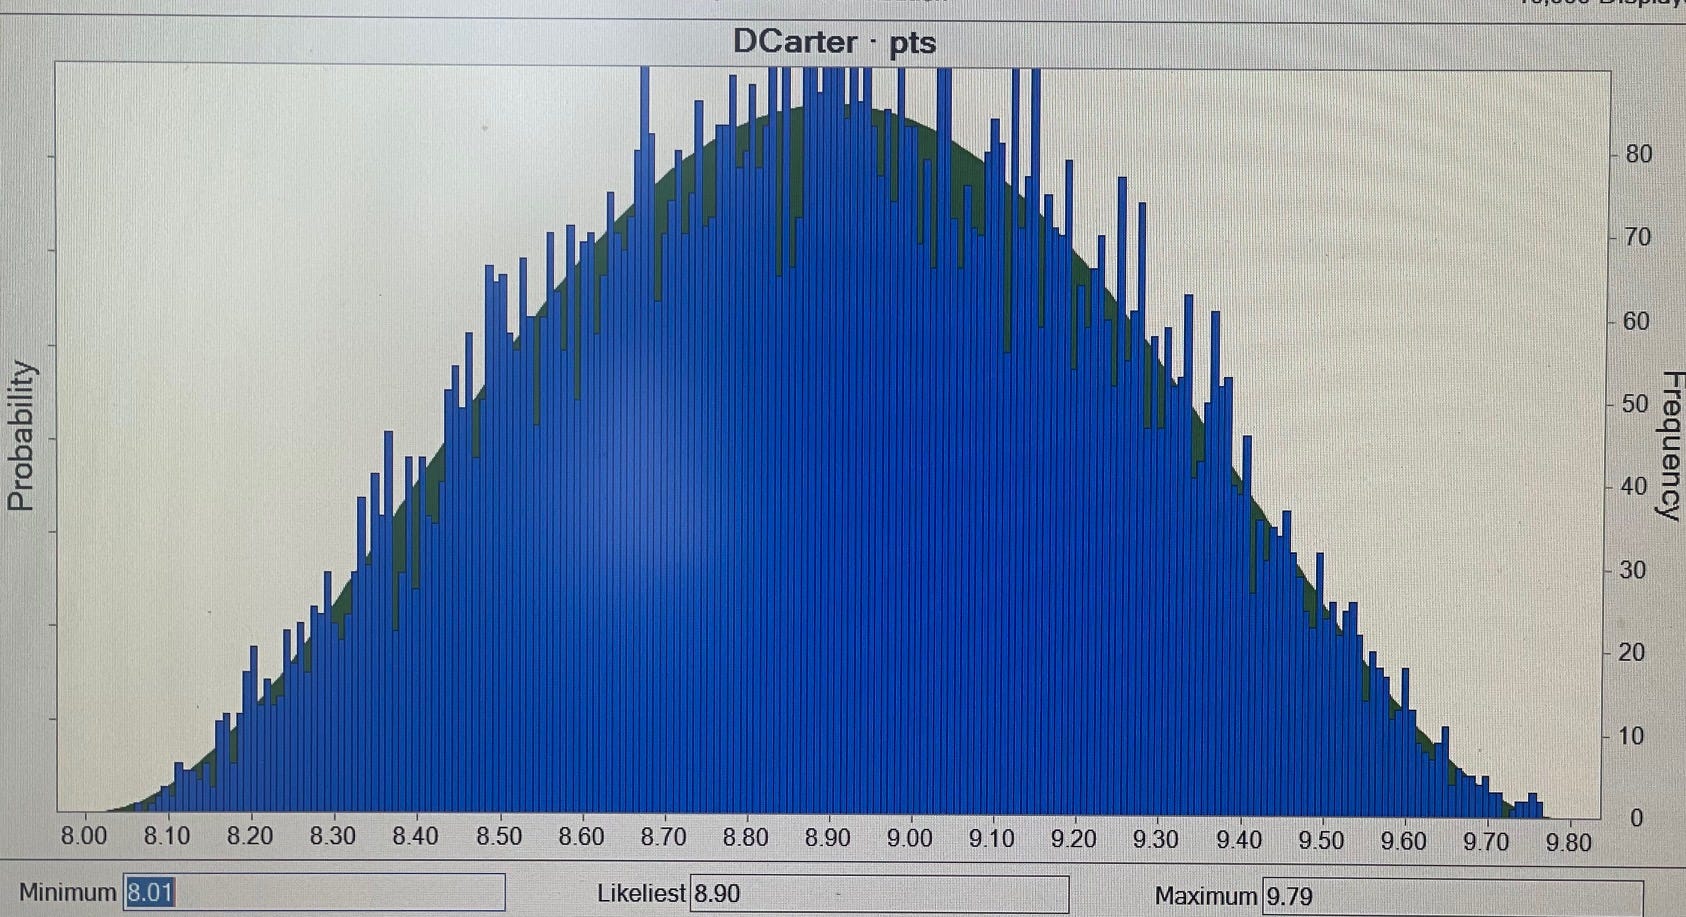
Lower numbers for Devin Carter
Devin Carter only averages 8.9 points per game, 4 points lower than last season.
Why is this? Theoretically, this could make sense. Although I didn’t include defense, he will be guarding the opponents’ best player.
The answer is that Providence has more offensive options this season, so it’s unlikely he’ll get 450 shots again. And Carter’s status as a junior means less improvement is estimated year over year in Torvik’s model. But perhaps most importantly, Carter shot under 30% from three last season. With his offensive usage dipping below 20%, his counting stats decrease.
But Carter’s lost production shows up elsewhere, in a big way:
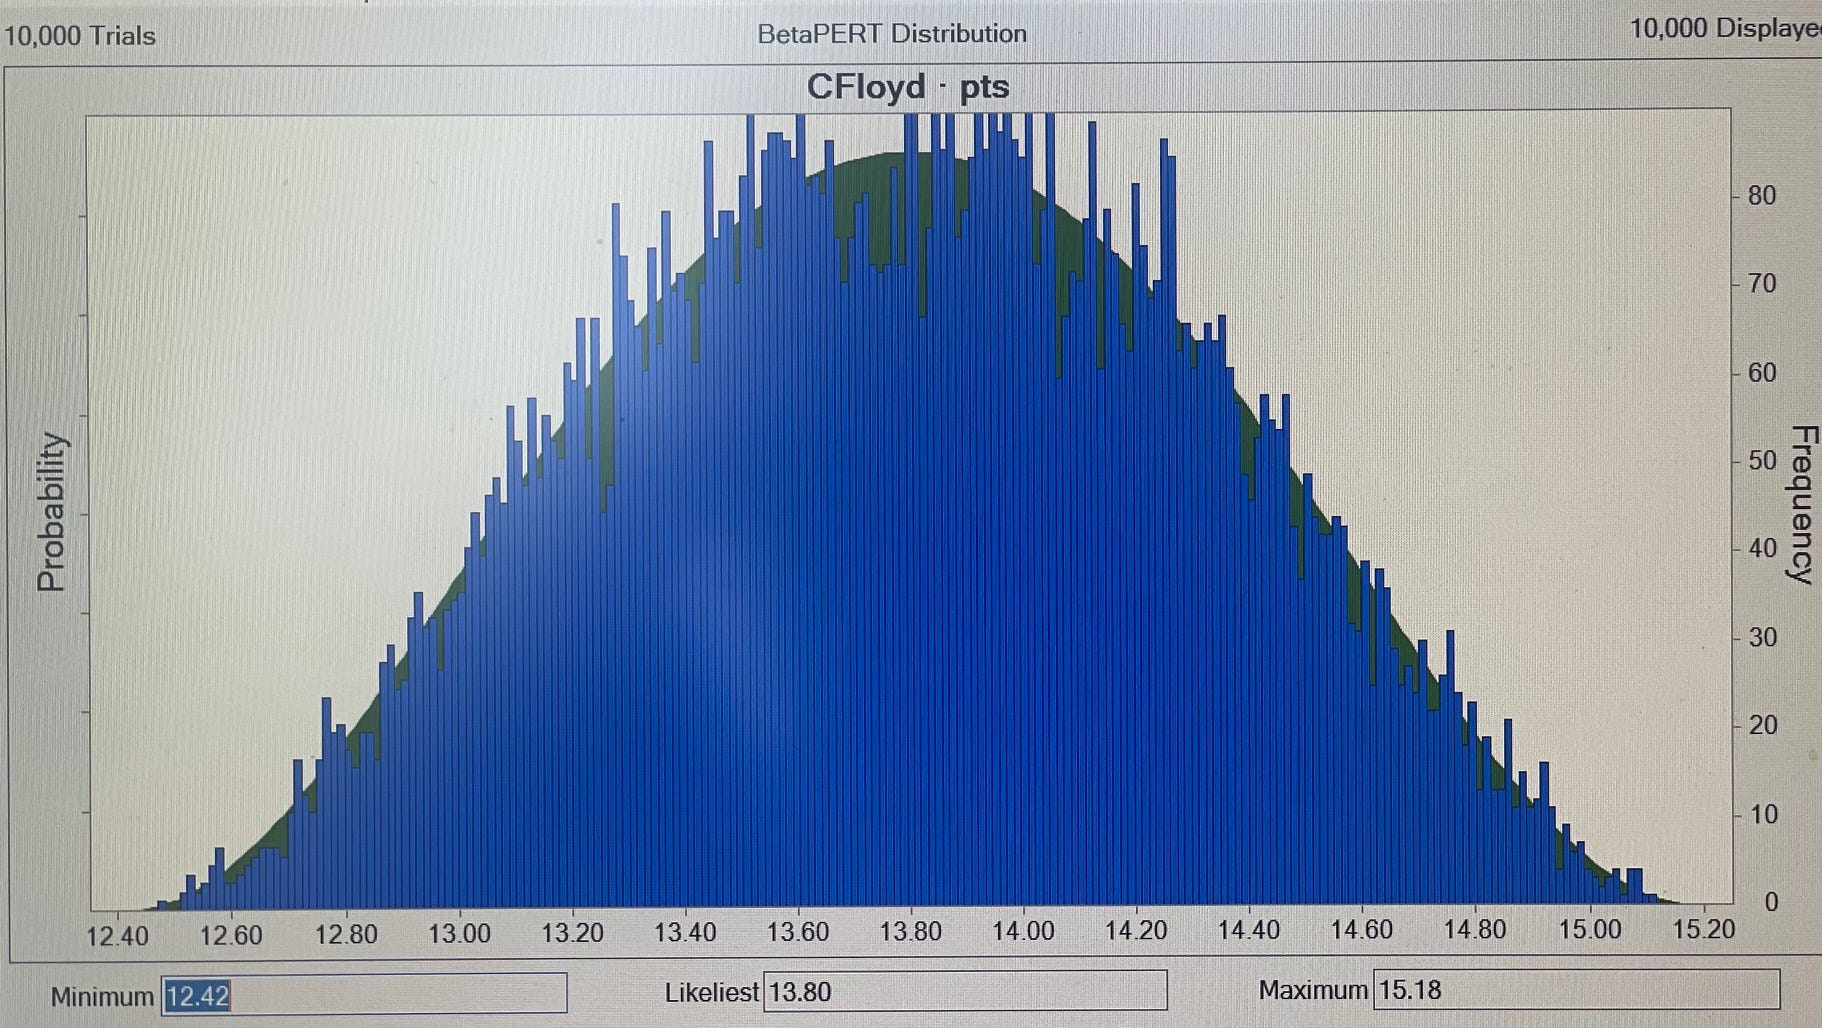
Corey Floyd Breaks Out
Torvik’s model particularly accelerates player improvement from freshman to sophomore year. And everything about the data on Corey Floyd screams plus player. He shot 42% from 3, 85% from the line, but with only 14% usage (20% is average) in less than 10 minutes per game.
The numbers say he was criminally underused last season. In this scenario, his minutes triple, his usage nearly doubles, and he is the true breakout player on the Providence roster at 13.8 points per game.
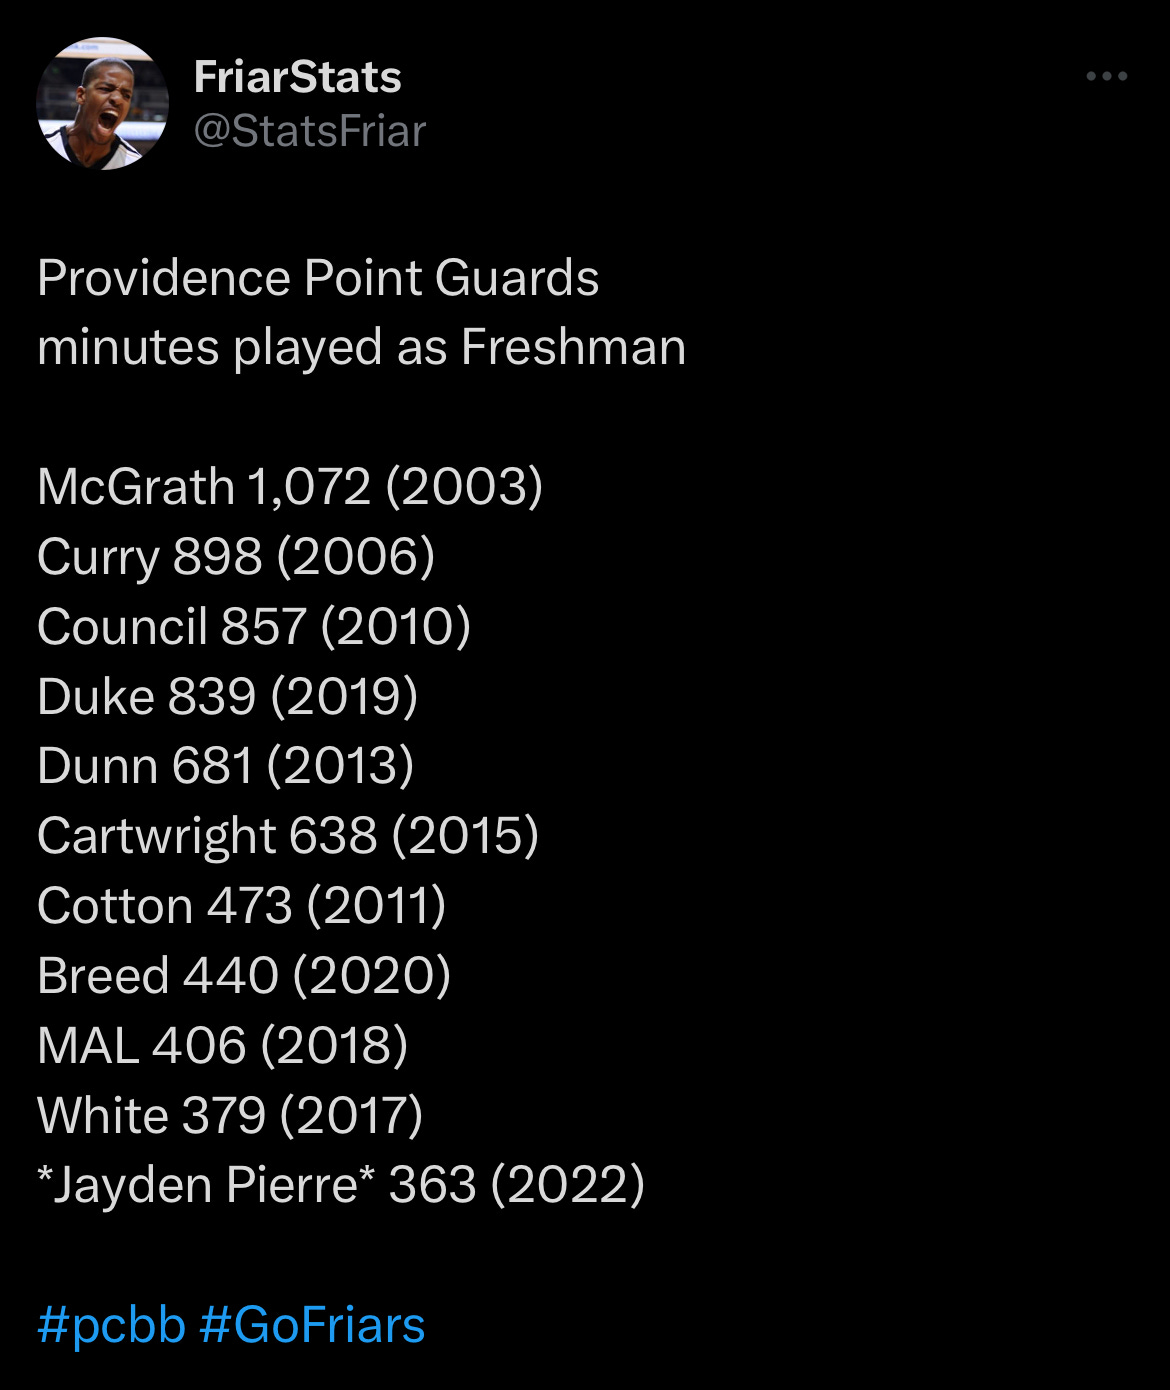
Pierre or Garwey? It’s Garwey
Pierre has a perfectly fine season. He averages 5.9 points and 1.6 rebounds in 20 minutes a game, more than doubling his points and minutes.
But Garwey Dual is the eventual starter at point guard, averaging 9.6 points and 3.8 rebounds. He plays 28 minutes a game and is 4th on the team in both points and usage.
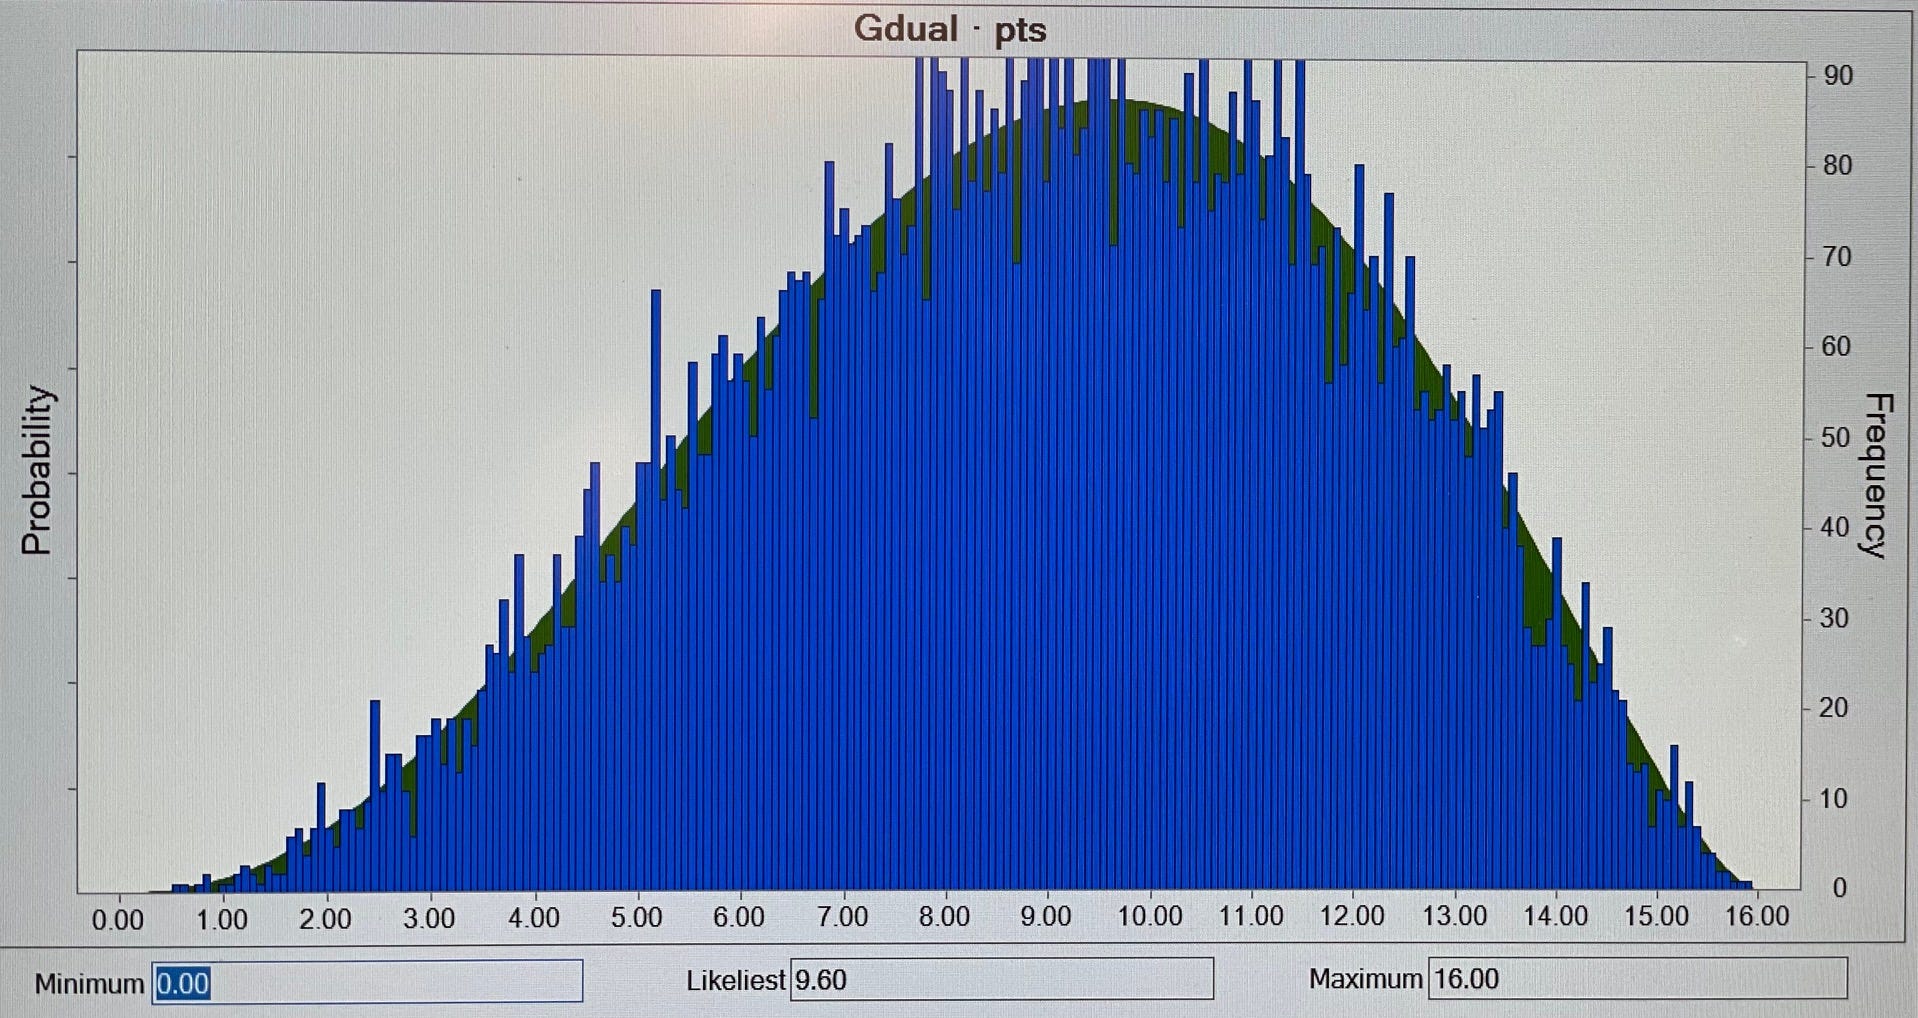
Based on the theoretical model, this makes sense. Garwey finished 38th in the final 247 composite recruiting rankings. Outside of the blue bloods and blue blood adjacents, freshman with lofty pedigree typically have big roles. And based on the limited minutes that Pierre played last season, along with his more modest recruiting ranking, his estimated production is lower.
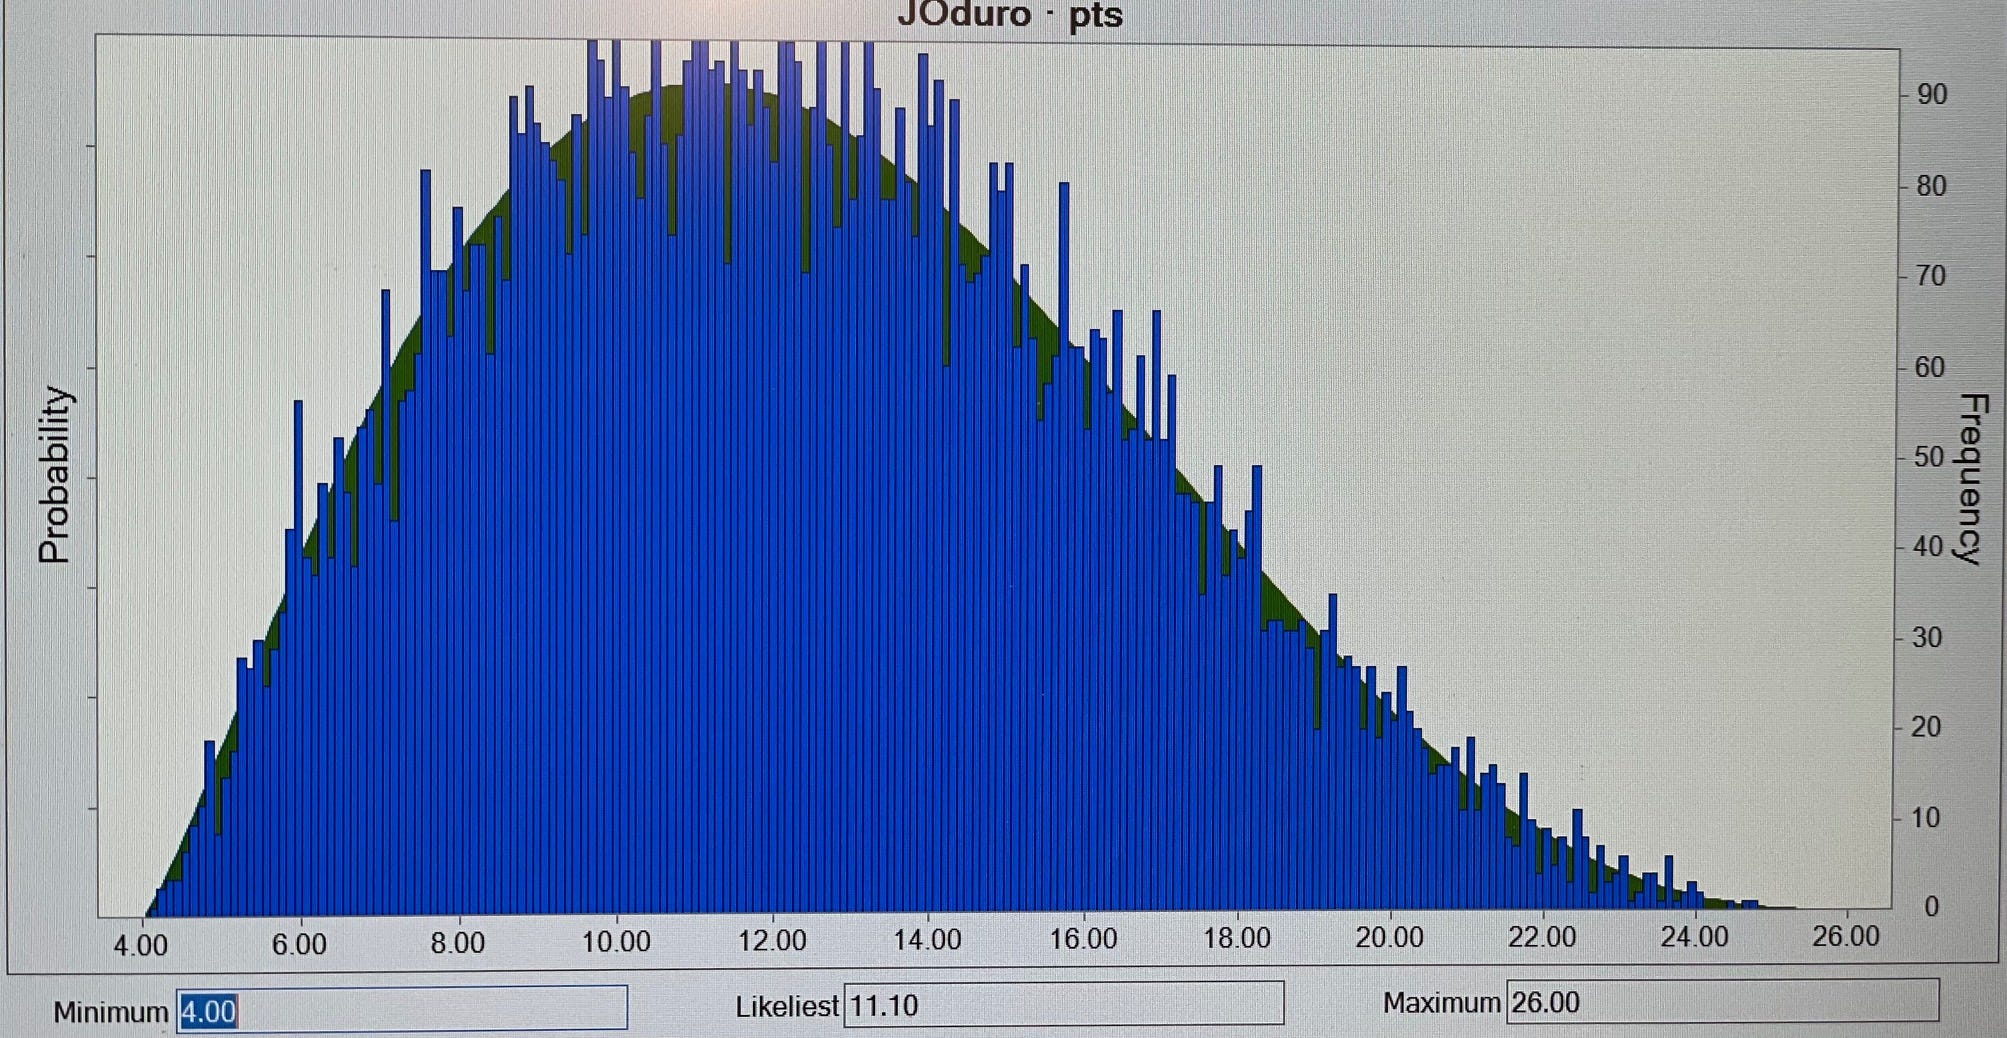
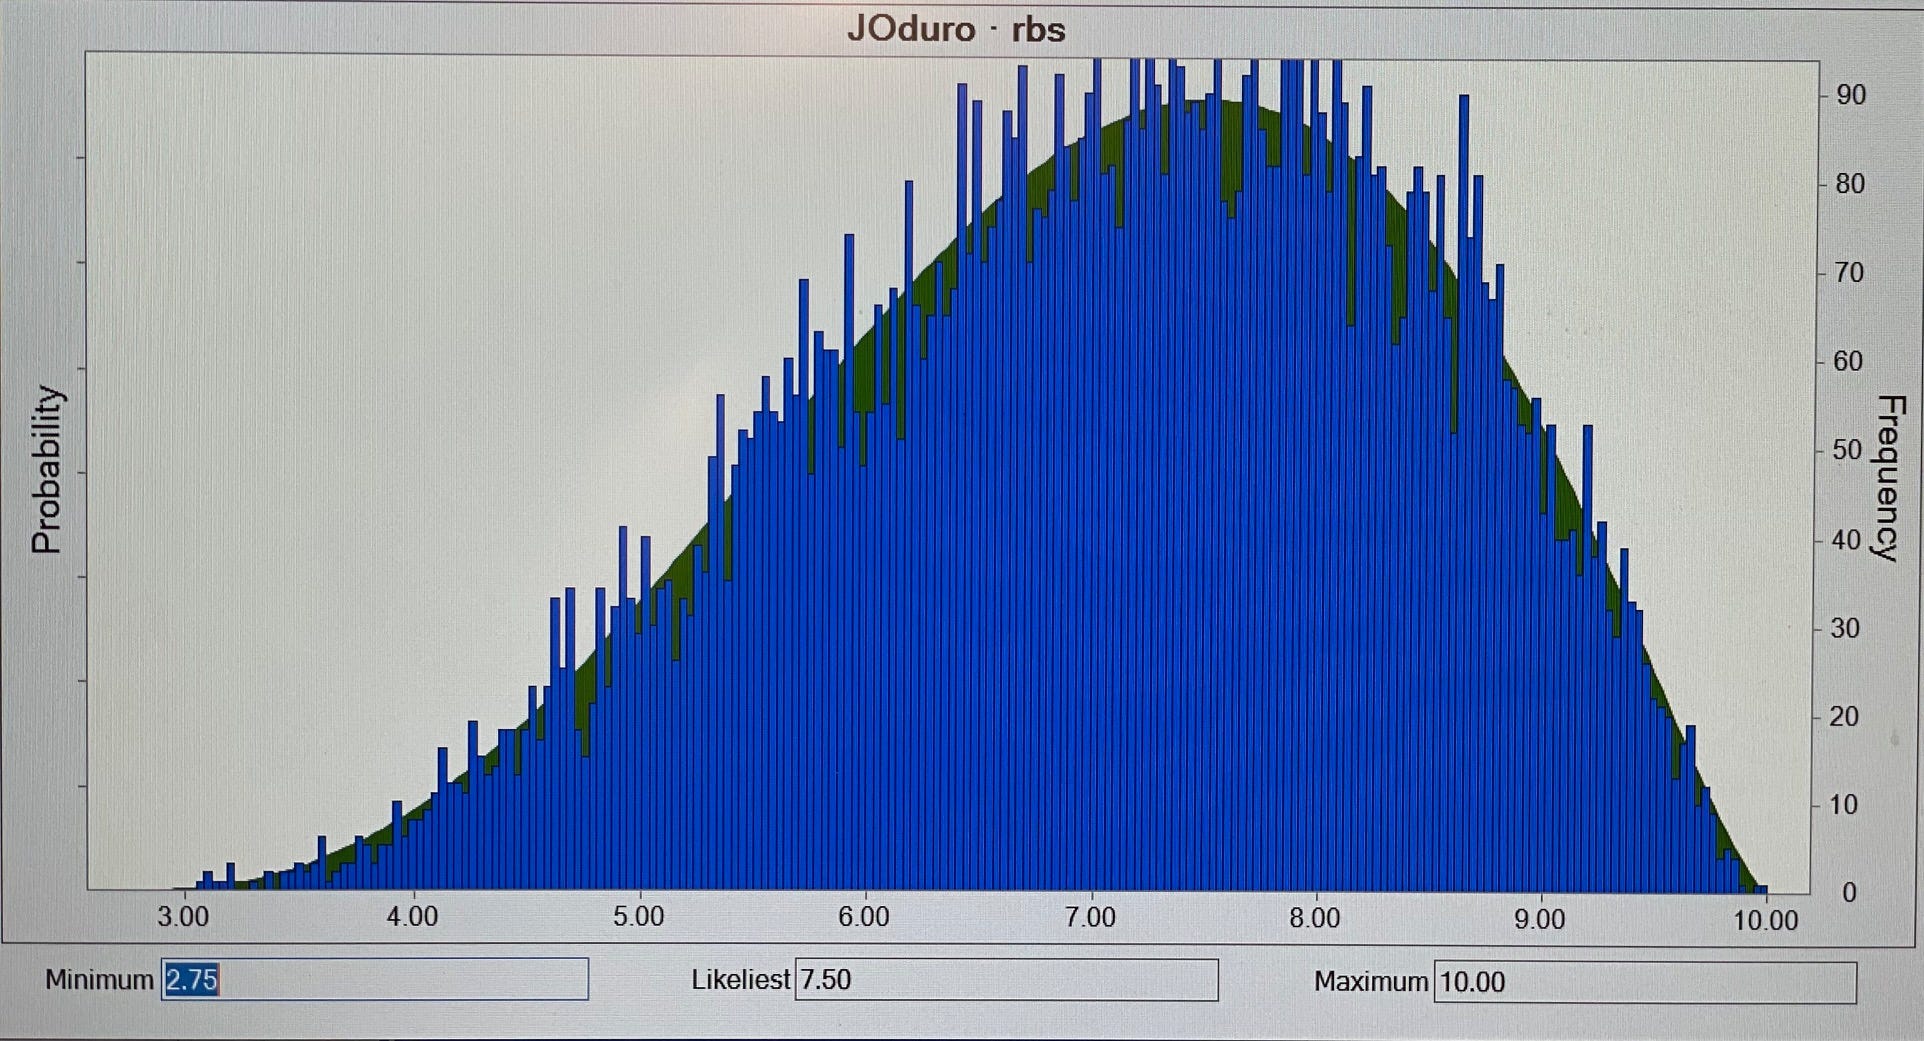
Josh Oduro keeps it going
Like Bryce Hopkins, Oduro has an exceptional season scoring the ball, nearly matching his total from Mason with 14.6 points per a game. He averages 7 rebounds, with a season high of 10. Torvik estimates that Oduro plays 28 mins a game with the highest usage on the team, taking ¼ of the shots from the floor when he’s in the game.
Plenty of room on Castro Island
There is only so much improvement possible in Torvik’s model for a player who’s only recorded 55 possessions in 168 minutes over 2 seasons.
Regardless, the simulation does suggest Castro plays a capable 11 backup minutes per game, averaging 4 points and 2.5 rebounds. This is equal to Cliff Moore’s production from last season - hopefully it just doesn't look like THAT.
Ticket Gains’ numbers are also on the lower side for a player who is expected to start, averaging 5.1 points but also 5.2 rebounds.
Guys, I think I found something. I think there is real opportunity in the three pointer. I mean, I was thinking about it and three pointers are worth fifty-percent more than two pointers. FIFTY-PERCENT! Let’s dive deeper into that. Take Ed Croswell for example, he only shot two three pointers last year. TWO! Yet his FGP was a staggering sixty-percent. Using some maths, we can see that if all his shots were three pointers instead of those two-point travesties, he would’ve scored 843 points last year instead of his 438. Like I said, opportunity. If the whole team adopted this approach, the fellas from Fri-town would’ve scored 5,751 points last season instead of their 2,499. As we step into the new season, I say to you king Friars, step outside that arc and fire that apple. That’s the power of opportunity. That’s the power of maths.